1
Please refer to important disclosures at the end of this report
1
1
Particulars (` Cr)
Q2FY20
Q1FY20
% chg (qoq)
Q1FY20
% chg (yoy)
NII
6,102
5,844
4
5,232
17
Pre-prov. profit
5,952
5,893
1
4,094
45
PAT
(106)
1,370
-
790
-
Source: Company, Angel Research
For Q1FY2020, Axis Bank reported loss of `106Cr primarily driven by one time
impact of deferred tax asset of `2,140Cr and higher provision of `3,512Cr
(Against Estimation of `2,063Cr). The key positives for the quarter were, increase
in pre-provision profit by 45% yoy and domestic loan growth by 19% yoy coupled
with an improvement in NIM.
Provision and slippages remained elevated: Higher slippages (3.8%) and credit
cost (2.7%) coupled with no clarity on watch list outside the BB & Below book
declared in Q1FY2020 (`6,700Cr) marred the performance of Q2. Out of the
total slippages of `4,983Cr, `2,862Cr slipped from corporate book and 97% is
from BB & Below book (`1,920Cr pertains to loan and `940Cr to investment
book). Notably, in Q1FY20, the management had given a new list of potential
stressed loans in 8 stressed corporate groups. Total exposure to above corporate
was `12,200Cr, of which exposure worth `6,700Cr is not part of BB & below
book, however no clarity has been in Q2FY2020. Nevertheless, the bank has
taken additional contingent provision worth `2,600Cr. We expect banks credit
cost to remain on higher side till overall stressed asset (BB&B book & Stressed
asset declared in Q1FY20) recognise as NPA.
Jump in other income, contained Opex aids pre-provision profit: During the
quarter, other income jumped by 45% yoy led by treasury gain worth `809Cr. The
key driver of core fee income growth was Retail fees, which grew 16% yoy and
constituted 64% of the Bank’s total fee income. Card fees grew strongly by 21%
yoy. Opex grew at 6% yoy aided by rationalisation of outsourced services, digital
initiatives and lower promotion spends. Management expects Opex to remain
contained for FY2020.
Retail loans drive momentum; NIM improves: During Q2FY2020, the bank’s
advances grew by 14% yoy, led by retail, up 23% yoy. However, overseas book
de-grew 25% yoy. Domestic NIMs improved by 11bps yoy to 3.51%.
Management guided NIM for FY2020 in the range on 3.5-3.8%. Deposit grew at
a healthy rate of 22% yoy; however, CASA grew 5% yoy. CASA ratio plunged by
660bps/22bps yoy/qoq to 41.1%, however other banks are also witnessing
decline in CASA ratio.
Outlook & Valuation: Axis Bank currently trades at 2x its FY2021E price to book
value (after adjusting value of subsidiaries). We expect the stock to get re-rated
owing to (1) new leadership, (2) receding stressed loan pool, and (3)
improvement in return ratios (ROA/ROE – 1.5%/15% by FY2021E). We
recommend Buy on the stock with a Target Price of `860.
Exhibit 1: Key Financials
Y/E March (` cr)
FY17
FY18
FY19
FY20E
FY21E
NII
18,093
18,618
21,708
24,940
30,040
% chg
7
3
17
15
20
Net profit
3,679
276
4,677
6,626
14,465
% chg
-55
(93)
1,596
42
118
NIM (%)
3.4
3.1
3.2
3.2
3.3
EPS (`)
13
1
17
24
51
P/E (x)
24
55
730
43
30
P/ABV (x)
3.8
3.8
3.5
3.2
2.3
RoA (%)
0.6
0.0
0.6
0.8
1.5
RoE (%)
7
0.5
7
8
15
Source: Company, Valuation done on closing price of 23/10/2019
BUY
CMP `714
Target Price `860
Investment Period 12 Months
Stock Info
Sector
Bloomberg Code
Shareholding Pattern (%)
Promoters 16.2
MF / Banks / Indian Fls 22.2
FII / NRIs / OCBs 47.1
Indian Public / Others 12.2
Abs. (%) 3m 1yr 3yr
Sensex 1.6 13.5 40.1
Axis Bank (2.3) 26.8 (6.7)
Nifty
11,604
Reuters Code
AXBK.BO
AXSB IN
Face Value (`)
2
BSE Sensex
39,058
52 Week High / Low
827/543
Avg. Daily Volume
2,71,058
Beta
1.3
Banking
Market Cap (` cr)
2,00,923
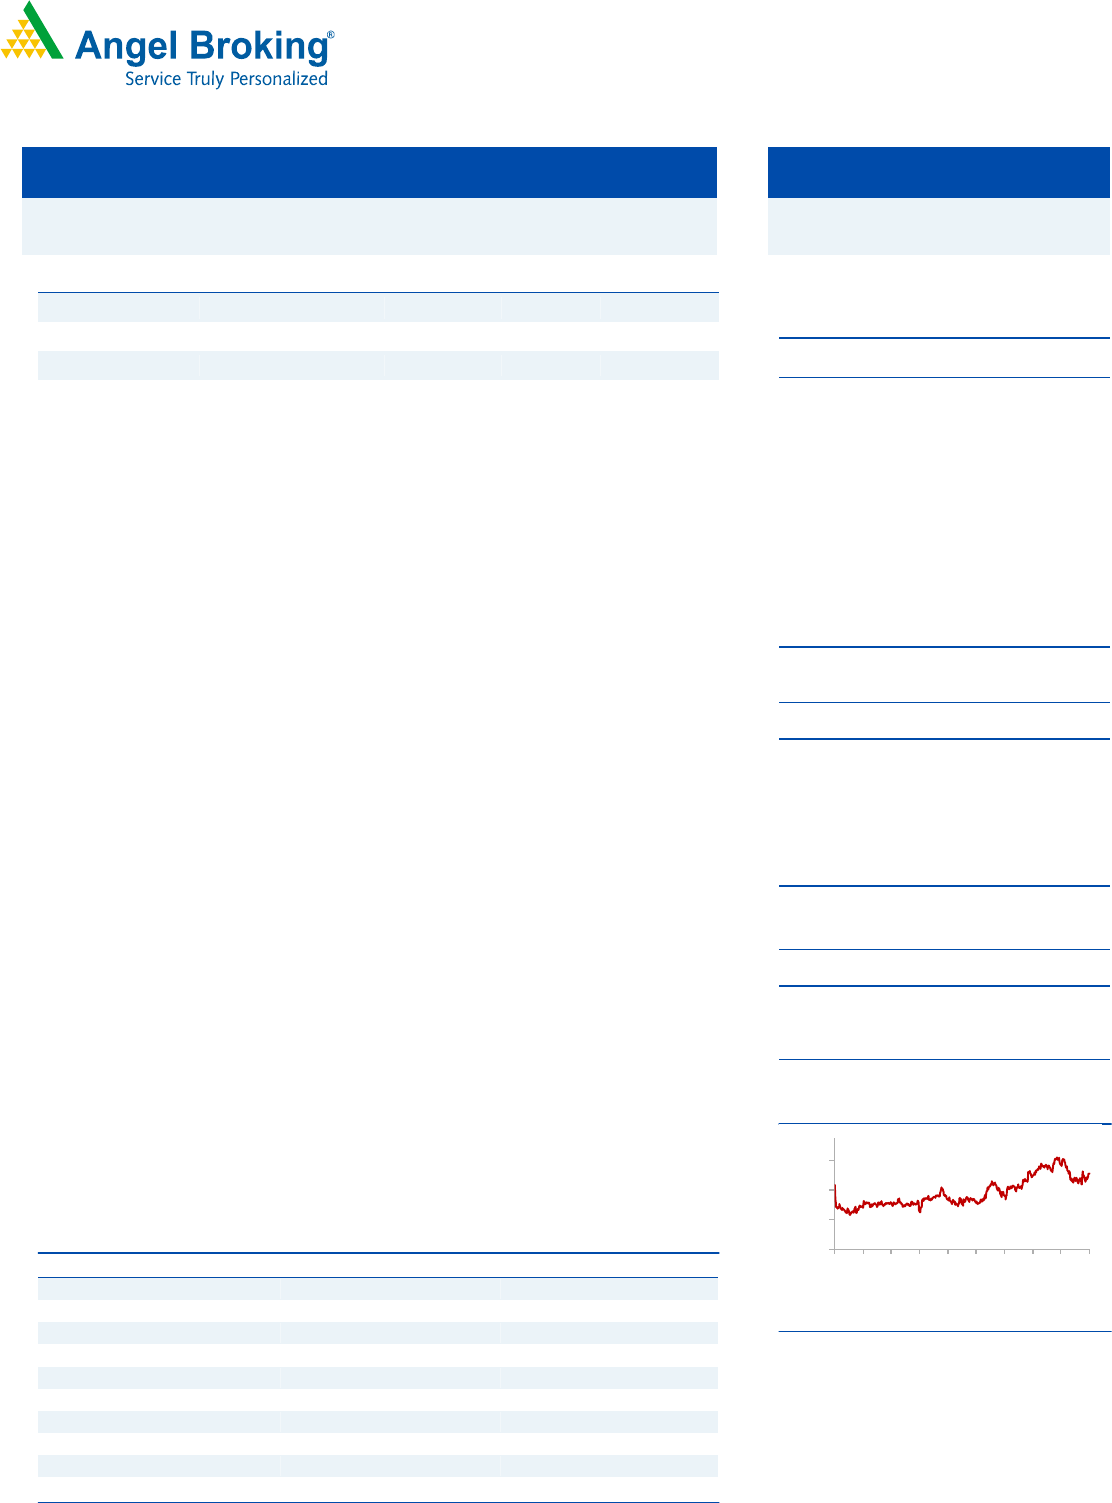
3-year price chart
Source: Company, Angel Research
200
400
600
800
Oct-16
Feb-17
Jun-17
Oct-17
Feb-18
Jun-18
Oct-18
Feb-19
Jun-19
Oct-19
Axis Bank
Strong operating performance; Slippages elevated
Q2FY2020 Result Update | Banking
Oct 24, 2019

2
Axis Bank|Q2FY2020 Result Update
Oct 24, 2019
2
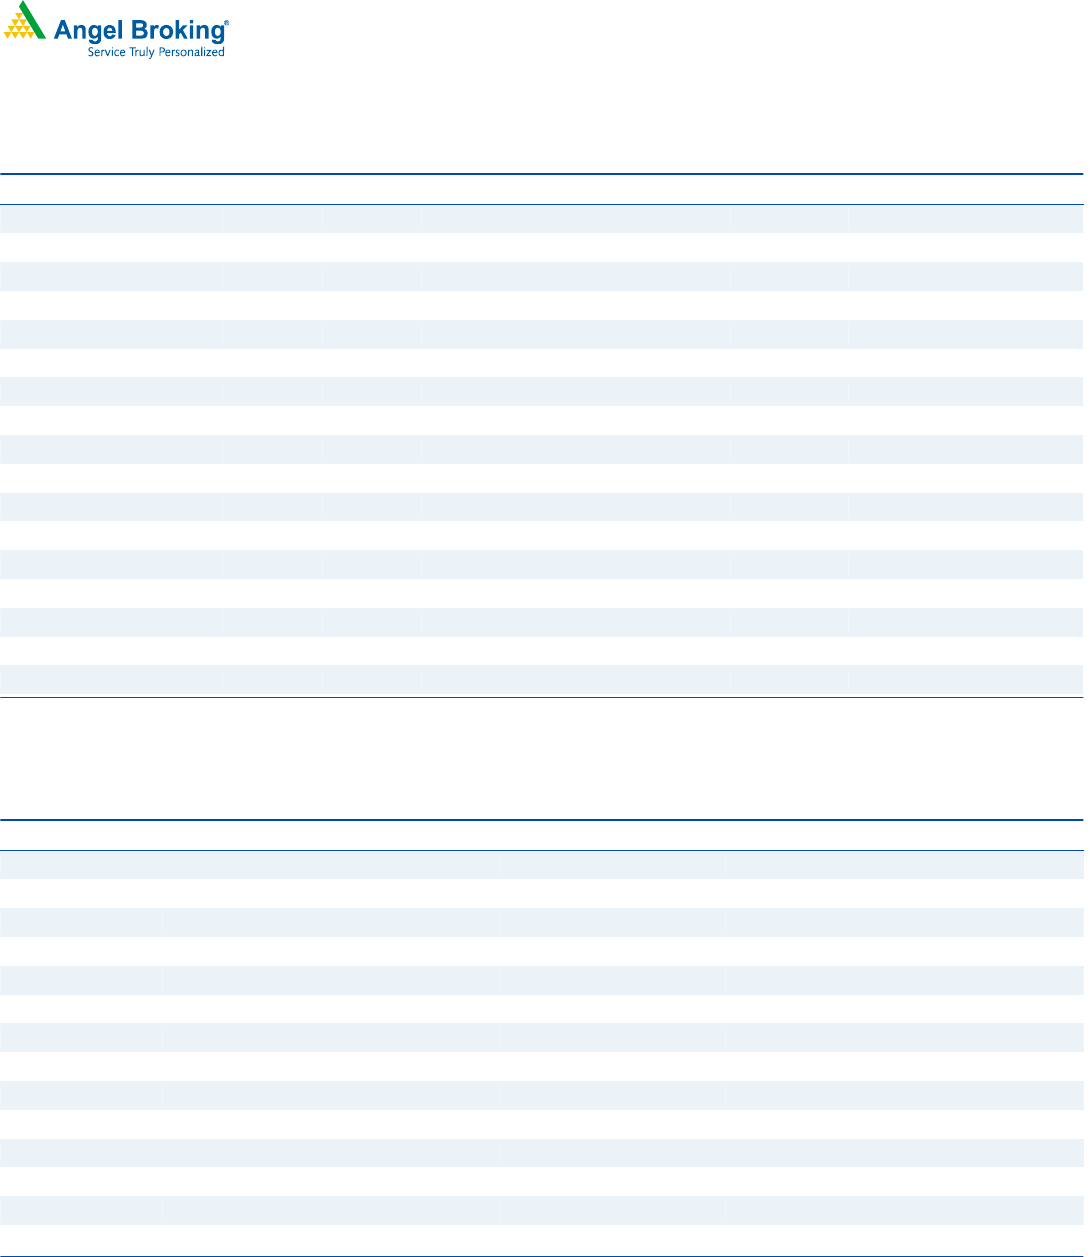
Exhibit 1: Quarterly Performance
Particulars (` cr)
Q1FY19
Q2FY19
Q3FY19
Q4FY19
Q1FY20
Q2FY20
% chg (qoq)
% chg (yoy)
Interest Earned
12,777
13,281
14,130
14,798
15,255
15,438
1
16
on Advances / Bills
9,612
9,955
10,628
11,127
11,461
11,924
4
20
on investments
2,682
2,802
2,894
2,971
3,119
2,868
(8)
2
on bal with RBI & others
125
162
183
224
192
195
2
21
on others
358
363
424
476
483
451
(7)
24
Interest Expended
7,610
8,049
8,526
9,092
9,411
9,336
(1)
16
Net Interest Income
5,167
5,232
5,604
5,706
5,844
6,102
4
17
Other Income
2,925
2,678
4,001
3,526
3,869
3,896
1
45
Operating income
8,092
7,910
9,604
9,232
9,712
9,998
3
26
Operating Expenses
3,720
3,816
4,080
4,217
3,820
4,046
6
6
Employee expenses
1,228
1,175
1,203
1,142
1,307
1,275
(2)
9
Other Opex
2,492
2,642
2,877
3,075
2,513
2,771
10
5
Pre.Prov Profit
4,372
4,094
5,525
5,014
5,893
5,952
1
45
Provisions & Contingencies
3,338
2,927
3,055
2,711
3,815
3,512
(8)
20
PBT
1,034
1,167
2,470
2,303
2,078
2,440
17
109
Provision for Taxes
333
377
789
798
708
2,545
259
575
Tax rate
32
32
32
35
34
104
206
223
PAT
701
790
1,681
1,505
1,370
(106)
-
-
Balance sheet
Advance (` Cr)
4,41,074
4,56,121
4,75,105
4,94,798
4,97,276
5,21,594
5
14
Deposit (` Cr)
4,47,079
4,79,680
5,14,092
5,48,471
5,40,678
5,83,958
8
22
Credit-to-Deposit Ratio (%)
99
95
92
90
92
89
(265.2)bp
(576.8)bp
CA (` Cr)
68,278
80,128
84,172
89,265
71,211
79,138
11
(1)
SA (` Cr)
1,41,359
1,48,742
1,51,380
1,54,129
1,52,263
1,60,916
6
8
CASA deposits (` Cr)
2,09,637
2,28,870
2,35,552
2,43,394
2,23,474
2,40,054
7
5
CASA %
47
48
46
44
41.3
41.1
(22.4)bp
(660.5)bp
CAR (%)
15
15
15
15
16.1
18
239bp
333bp
Tier 1 CAR (%)
12
12
12
11
12.9
14
114bp
233bp
Profitability Ratios (%)
Yield Advance
8.73
8.88
9.13
9.18
9.24
9.23
(1.4)bp
35.1bp
COF REPO
5.23
5.34
5.44
5.69
5.70
5.6
(8)bp
28bp
Reported NIM - Domestic
3.50
3.59
3.61
3.61
3.56
3.6
7bp
4bp
Cost-to-income ratio
0.46
0.48
0.42
0.46
0.39
0.40
1.1bp
(7.8)bp
Asset quality
Gross NPAs (` Cr)
32,662
30,938
30,855
29,789
29,405
29,071
(1)
(10)
Gross NPAs (%)
6.52
5.96
5.75
5.26
5.25
5.03
(22)bp
(93)bp
Net NPAs (` Cr)
14,902
12,716
12,233
11,276
11,037
11,138
(2)
(26)
Net NPAs (%)
3.09
2.54
2.36
2.06
2.04
2
(5)bp
(55)bp
PCR (%)
53
57
59
61
61
60
(70.5)bp
305.5bp
Slippage ratio (%)
1.0
0.6
0.8
0.6
1.0
1.0
(1)bp
34.7bp
Credit Cost on Adv
0.8
0.6
0.6
0.5
0.8
0.7
(9.4)bp
3.2bp
Source: Company, Angel Research
3
Axis Bank|Q2FY2020 Result Update
Oct 24, 2019
3
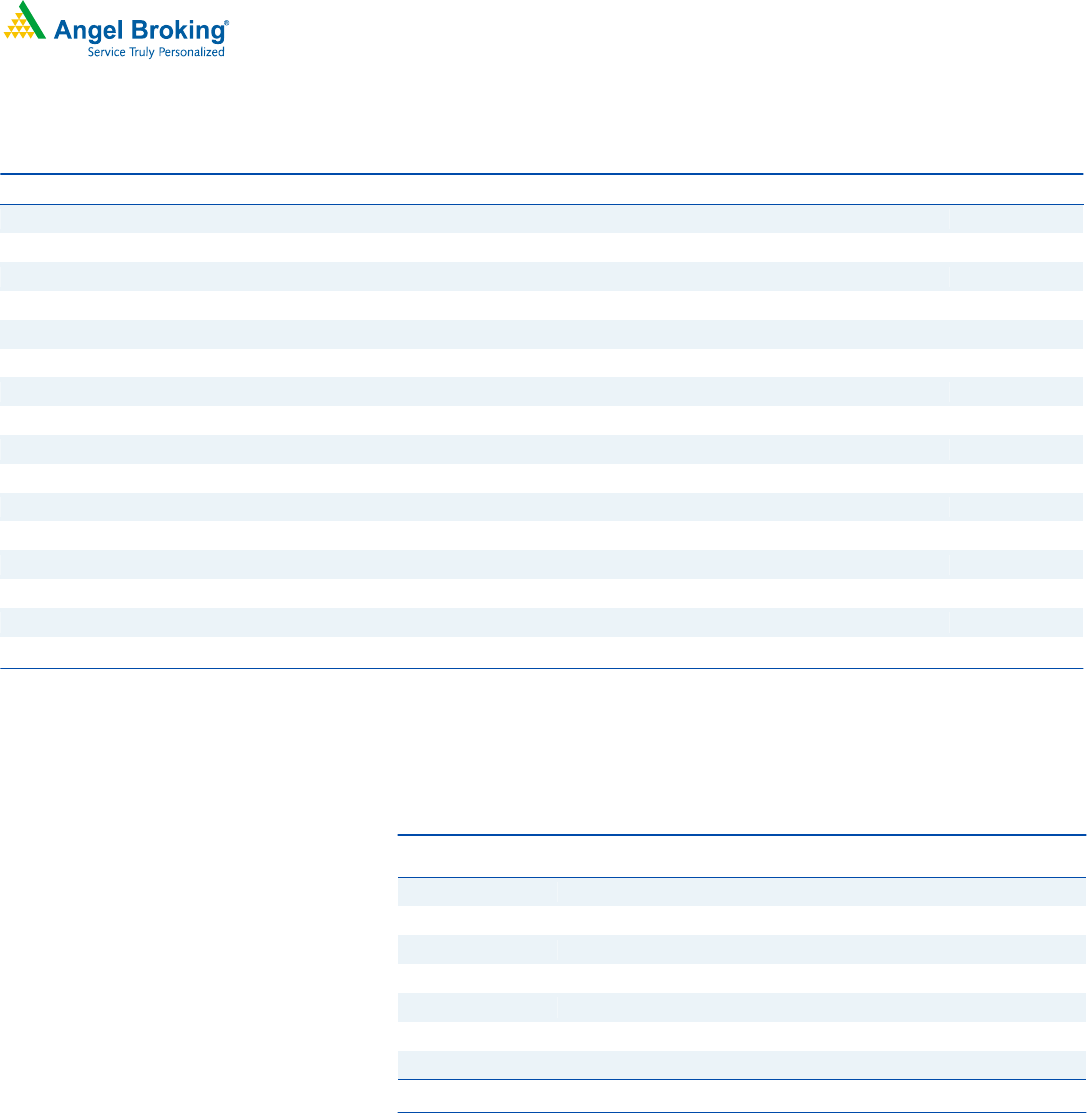
Exhibit 2: Advance
Particular (` Cr)
Q1FY19
Q2FY19
Q3FY19
Q4FY19
Q1FY20
Q2FY20
% chg (qoq)
% chg (yoy)
Retail
211648
221710
232397
245812
258205
273223
6
23
Home Loan
84659
86467
90635
93409
98118
101093
3
17
Rural Lending
29631
28822
32536
34414
30985
35519
15
23
Auto Loan
23281
24388
25564
27039
30985
32787
6
34
PL
21165
24388
25564
29497
30985
32787
6
34
LAP
16932
19954
18592
22123
20656
24590
19
23
CC
8466
8868
11620
12291
12910
13661
6
54
SBB
6349
6651
6972
7374
10328
10929
6
64
Other
21165
22171
20916
19665
23238
21858
(6)
(1)
Corporate Banking
172443
174149
180469
183402
177455
187000
5
7
Term Loan
121948
119520
124698
1,21,122
119379
1,27,096
6
6
WC
50495
54629
55771
62,279
58076
59,904
3
10
SME
56983
60262
62238
65584
61616
61371
(0)
2
Term Loan
12348
12496
12846
13,475
12757
13,047
2
4
WC
44635
47766
49392
52,109
48859
48,324
(1)
1
Total
441074
456121
475104
494798
497276
521594
5
14
Source: Company, Angel Research
Exhibit 3: GNPA Movement
Particular
Q3FY18
Q4FY18
Q1FY19
Q2FY19
Q3FY19
Q4FY19
Q1FY20
Q2FY20
GNPA Opening
27,402
25,001
34,249
32,662
30,938
30,855
29,790
29,406
Fresh Slippage
4,428
16,536
4,337
2,777
3,746
3,012
4,798
4,983
Slippage (%)
1.1%
3.8%
1.0%
0.6%
0.8%
0.6%
1.0%
1.0%
Slippage Annual
4.2%
15.0%
3.9%
2.4%
3.2%
2.4%
3.9%
3.8%
Upgrade & Recovery
4,008
3,401
2,917
2,186
1,622
2,376
2,177
2,213
Write off
2,821
3,887
3,007
2,315
2,207
1,701
3,005
3,104
Closing GNPA
25,001
34,249
32,662
30,938
30,855
29,790
29,406
29,072
Provision
13,232
17,657
17,760
18,222
18,622
18,513
18,367
17,933
NPA
11,769
16,592
14,902
12,716
12,233
11,277
11,039
11,139
Prov
2,811
7,180
3,338
2,927
3,055
2,711
3,815
3,512
Credit Cost (%)
0.7%
1.6%
0.8%
0.6%
0.6%
0.5%
0.8%
0.7%
CC Ann (%)
2.7%
6.5%
3.0%
2.6%
2.6%
2.2%
3.1%
2.7%
Source: Company, Angel Research
4
Axis Bank|Q2FY2020 Result Update
Oct 24, 2019
4
Exhibit 4: Non-NPL stress declared in Q1FY20
Particular (` cr)
Q1FY20
BB & Below rated loans as on1QFY20
7,504
Non-Fund based stress pool (NFB to BB & Below & NPLs)
2,500
Security Receipt
2,940
Total of existing stress (1)
12,944
New list (After removing overlap)
New loan addition (Exposure 7,000cr and 3,900cr considered in NPA & BB & Below)
3,100
New Non-Fund based addition (Actual 3,000cr and 1,000cr considered in NPA)
2,000
New Investment addition (Exposure 2,200cr and NPA/MTM taken 200cr/400cr)
2,000
Total of new list (2)
7,100
Total stress on loans (1)+(2)
20,044
Provisions on non-NPL stress
2,358
Total stress loans
17,686
Total stress loans (%)
3.56
Source: Company
Exhibit 5: SOTP
Sum of the parts
Stake in Company%
Valuation
Methodology
Value/Share `
Core Business
100.0
2.4x FY21E ABV
836
Axis Capital Ltd
100
15x FY21E PAT
9.1
Axis MF
75
20x FY21E PAT
3.9
Axis Fin
100
1.5x FY21E Book Value
9.8
Axis Sec
100
15x FY21E PAT
4.9
holding value post 20% disc
22.1
Sum of Parts
860
Source: Company, Angel Research, Valuation done on closing price of 23/10/2019

5
Axis Bank|Q2FY2020 Result Update
Oct 24, 2019
5
Income Statement
Y/E March (` cr)
FY17
FY18
FY19E
FY20E
FY21E
Net Interest Income
18,093
18,618
21,708
24,940
30,040
- YoY Growth (%)
7
3
17
15
20
Other Income
11,691
10,967
13,130
15,457
17,347
- YoY Growth (%)
25
(6)
20
18
12
Operating Income
29,784
29,585
34,839
40,396
47,388
- YoY Growth (%)
14
(1)
18
16
17
Operating Expenses
12,200
13,990
15,833
17,339
19,799
- YoY Growth (%)
21
15
13
10
14
Pre - Provision Profit
17,585
15,594
19,005
23,058
27,589
- YoY Growth (%)
9
(11)
22
21
20
Prov. & Cont.
12,117
15,473
12,031
11,375
8,259
- YoY Growth (%)
227
28
(22)
(5)
(27)
Profit Before Tax
5,468
122
6,974
11,683
19,330
- YoY Growth (%)
-56
(98)
5,637
68
65
Prov. for Taxation
1,788
(154)
2,297
5,057
4,865
- as a % of PBT
33
(127)
33
43
25
PAT
3,679
276
4,677
6,626
14,465
- YoY Growth (%)
(55)
(93)
1,596
42
118
Balance Sheet
Y/E March (` cr)
FY17
FY18
FY19E
FY20E
FY21E
Equity
479
513
513
524
524
Reserve & Surplus
55,284
62,932
66,676
88,969
1,02,711
Net worth
55,763
63,445
67,190
89,493
1,03,235
Deposits
4,14,379
4,53,623
5,48,471
6,36,227
7,50,748
- Growth (%)
16
9
21
16
18
Borrowings
1,05,031
1,48,016
1,52,776
1,60,415
1,76,456
Other Liab. & Prov.
26,387
26,373
28,733
15,985
18,946
Total Liabilities
6,01,559
6,91,458
7,97,169
9,02,119
10,49,384
Cash Balances
30,858
35,481
35,099
45,641
46,349
Bank Balances
19,398
7,974
32,630
13,159
15,426
Investments
1,28,793
1,53,876
1,74,969
2,00,132
2,28,648
Advances
3,73,069
4,39,650
4,94,798
5,73,966
6,77,279
- Growth (%)
10
18
13
16.0
18
Fixed Assets
3,747
3,972
4,827
5,599
6,607
Other Assets
45,693
50,505
54,847
63,623
75,075
Total Assets
6,01,559
6,91,458
7,97,169
9,02,119
10,49,384
- Growth (%)
11
15
15
13
16

6
Axis Bank|Q2FY2020 Result Update
Oct 24, 2019
6
Key Ratio
Y/E March
FY17
FY18
FY19
FY20E
FY21E
Profitability ratios (%)
NIMs
3.43
3.13
3.16
3.18
3.34
Cost to Income Ratio
41
47
45
43
42
RoA
0.6
0.0
0.6
0.8
1.5
RoE
7
0
7
8
15
B/S ratios (%)
CASA Ratio
51.4
53.8
44.4
44.4
44.4
Credit/Deposit Ratio
90
97
90
90
90
Asset Quality (%)
Gross NPAs
5.04
6.77
5.0
4.0
3.8
Net NPAs
2.11
3.40
2.3
1.6
1.5
Credit Cost
3.2
3.5
2.4
2.0
1.2
Provision Coverage
0.58
0.50
0.54
0.60
0.61
Per Share Data (`)
EPS
13
1
17
24
51
ABVPS (70% cover.)
190
203
224
309
358
DPS
5
5
5
5
7
Valuation Ratios
PER (x)
24
55
730
43
30
P/ABVPS (x)
3.8
3.8
3.5
3.2
2.3
Dividend Yield (%)
0.6
0.7
0.7
0.7
0.7
DuPont Analysis
FY17
FY18
FY19E
FY20E
FY21E
NII
3.2
2.9
2.9
2.9
3.1
- Prov
2.1
2.4
1.6
1.3
0.8
Adj NII
1.0
0.5
1.3
1.6
2.2
Other Income
2.0
1.7
1.8
1.8
1.8
Total Income
3.1
2.2
3.1
3.4
4.0
Opex
2.1
2.2
2.1
2.04
2.0
PBT
1.0
0.0
0.9
1.4
2.0
TAX
0.3
-0.0
0.3
0.6
0.5
RoA
0.6
0.0
0.63
0.78
1.48
Leverage
10.5
10.8
11.4
10.8
10.1
RoE
6.8
0.5
7.2
8.5
15.0
Valuation done on closing price of 23/10/2019

7
Axis Bank|Q2FY2020 Result Update
Oct 24, 2019
7
Disclosure of Interest Statement Axis Bank
1. Financial interest of research analyst or Angel or his Associate or his relative No
2. Ownership of 1% or more of the stock by research analyst or Angel or associates or relatives No
3. Served as an officer, director or employee of the company covered under Research No
4. Broking relationship with company covered under Research No
Ratings (Based on expected returns Buy (> 15%) Accumulate (5% to 15%) Neutral (-5 to 5%)
over 12 months investment period): Reduce (-5% to -15%) Sell (< -15)
Research Team Tel: 022 - 39357800 E-mail: [email protected] Website: www.angelbroking.com
Angel Broking Limited (hereinafter referred to as “Angel”) is a registered Member of National Stock Exchange of India Limited, Bombay
Stock Exchange Limited, Metropolitan Stock Exchange Limited, Multi Commodity Exchange of India Ltd and National Commodity &
Derivatives Exchange Ltd It is also registered as a Depository Participant with CDSL and Portfolio Manager and Investment Adviser with
SEBI. It also has registration with AMFI as a Mutual Fund Distributor. Angel Broking Limited is a registered entity with SEBI for Research
Analyst in terms of SEBI (Research Analyst) Regulations, 2014 vide registration number INH000000164. Angel or its associates has not
been debarred/ suspended by SEBI or any other regulatory authority for accessing /dealing in securities Market. Angel or its
associates/analyst has not received any compensation / managed or co-managed public offering of securities of the company covered
by Analyst during the past twelve months.
This document is solely for the personal information of the recipient, and must not be singularly used as the basis of any investment
decision. Nothing in this document should be construed as investment or financial advice. Each recipient of this document should
make such investigations as they deem necessary to arrive at an independent evaluation of an investment in the securities of the
companies referred to in this document (including the merits and risks involved), and should consult their own advisors to determine
the merits and risks of such an investment.
Reports based on technical and derivative analysis center on studying charts of a stock's price movement, outstanding positions and
trading volume, as opposed to focusing on a company's fundamentals and, as such, may not match with a report on a company's
fundamentals. Investors are advised to refer the Fundamental and Technical Research Reports available on our website to evaluate the
contrary view, if any
The information in this document has been printed on the basis of publicly available information, internal data and other reliable
sources believed to be true, but we do not represent that it is accurate or complete and it should not be relied on as such, as this
document is for general guidance only. Angel Broking Limited or any of its affiliates/ group companies shall not be in any way
responsible for any loss or damage that may arise to any person from any inadvertent error in the information contained in this report.
Angel Broking Limited has not independently verified all the information contained within this document. Accordingly, we cannot testify,
nor make any representation or warranty, express or implied, to the accuracy, contents or data contained within this document. While
Angel Broking Limited endeavors to update on a reasonable basis the information discussed in this material, there may be regulatory,
compliance, or other reasons that prevent us from doing so.
This document is being supplied to you solely for your information, and its contents, information or data may not be reproduced,
redistributed or passed on, directly or indirectly.
Neither Angel Broking Limited, nor its directors, employees or affiliates shall be liable for any loss or damage that may arise from or in
connection with the use of this information.